8. Dashboard Page
Dashboard page is designed to display a summary of the actions performed by WP Content Crawler. You can track which sites are active, which type of events are active for a specific site, how many posts are saved, updated, and deleted for each site, recently saved, updated, and deleted posts, the next and the last time of an event’s run for each site, and so on.
The following video demonstrates the dashboard page.
Note
At the beginning of the video, the scheduling settings are shown. That part is displayed so that you can pause the video and observe the settings if you want. Since the video’s main focus is to demonstrate the dashboard page, the general settings are shown for a short amount of time.
In the video, two sites are activated for scheduling, updating, and deleting events. The
dashboard page is set to refresh every 10 seconds so that changes are reflected frequently.
The dashboard page is recorded for about 20 minutes. That 20-minute-long part is played 20
times fast in order not to keep you waiting. You can observe that many posts were saved, updated,
and deleted. The number of posts that were saved, updated, and deleted are shown for each site in
Active Sites Section. You can also see which site will be crawled next in
What’s Happening Section. The saved posts can be observed in
Last Crawled Posts Section in the video. For more information about the sections,
please refer to their documentations.
8.1. Active Sites Section
This section displays the sites that are active for at least one of scheduling, recrawling or deleting events.
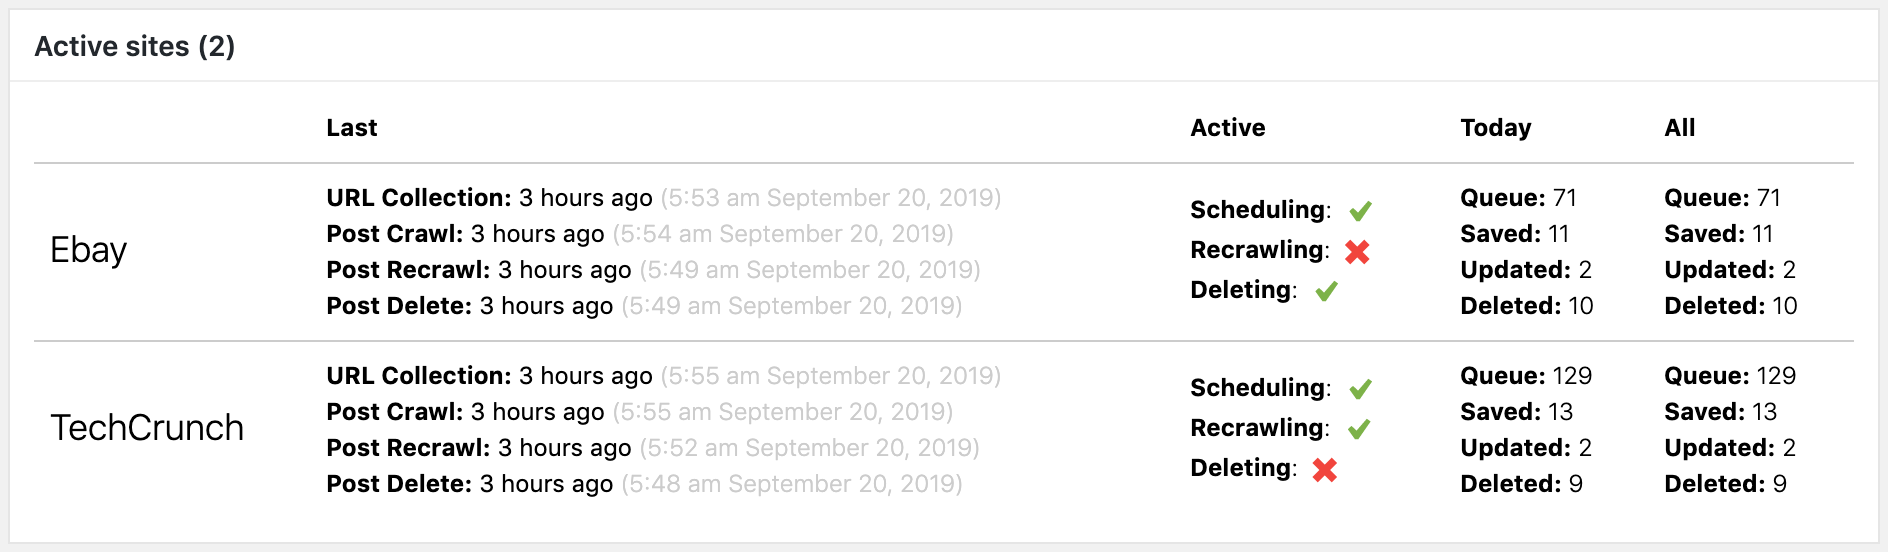
Fig. 8.1 Active Sites Section displaying two active sites
Fig. 8.1 shows a screenshot of this section. There are two active sites. The first one is active for scheduling and deleting, while the other is active for scheduling and recrawling. The columns of this section are explained as follows.
- Last
- This column shows the last time an event was run for the site. The time for each event is displayed next to the event’s name.
- Active
- This column displays which events are activated for the site. If an event is active, a green checkbox symbol is shown. Otherwise, a red X symbol is shown.
- Today and All
These columns display number of posts and URLs.
Todaycolumn displays the numbers for the current day, starting from00:00:00until23:59:59.Allcolumn displays the numbers without any restriction. The columns are explained as follows.- Queue
- Number of post URLs in the queue. These URLs are the URLs that are not crawled yet. In other words, the posts shown at the URLs are not created in your site, yet. They will be crawled according to the scheduling settings.
- Saved
- Number of saved posts
- Updated
- Number of updated posts
- Deleted
- Number of deleted posts
Tip
If a site is not shown in this section, then it is not activated for any event. You can activate the site for the events from under Main Tab of Site Settings Page.
8.2. What’s Happening Section
This section displays a summary of the times of the CRON events and number of posts saved, deleted, and updated, as well as which URLs are currently being crawled and which posts are currently being updated.
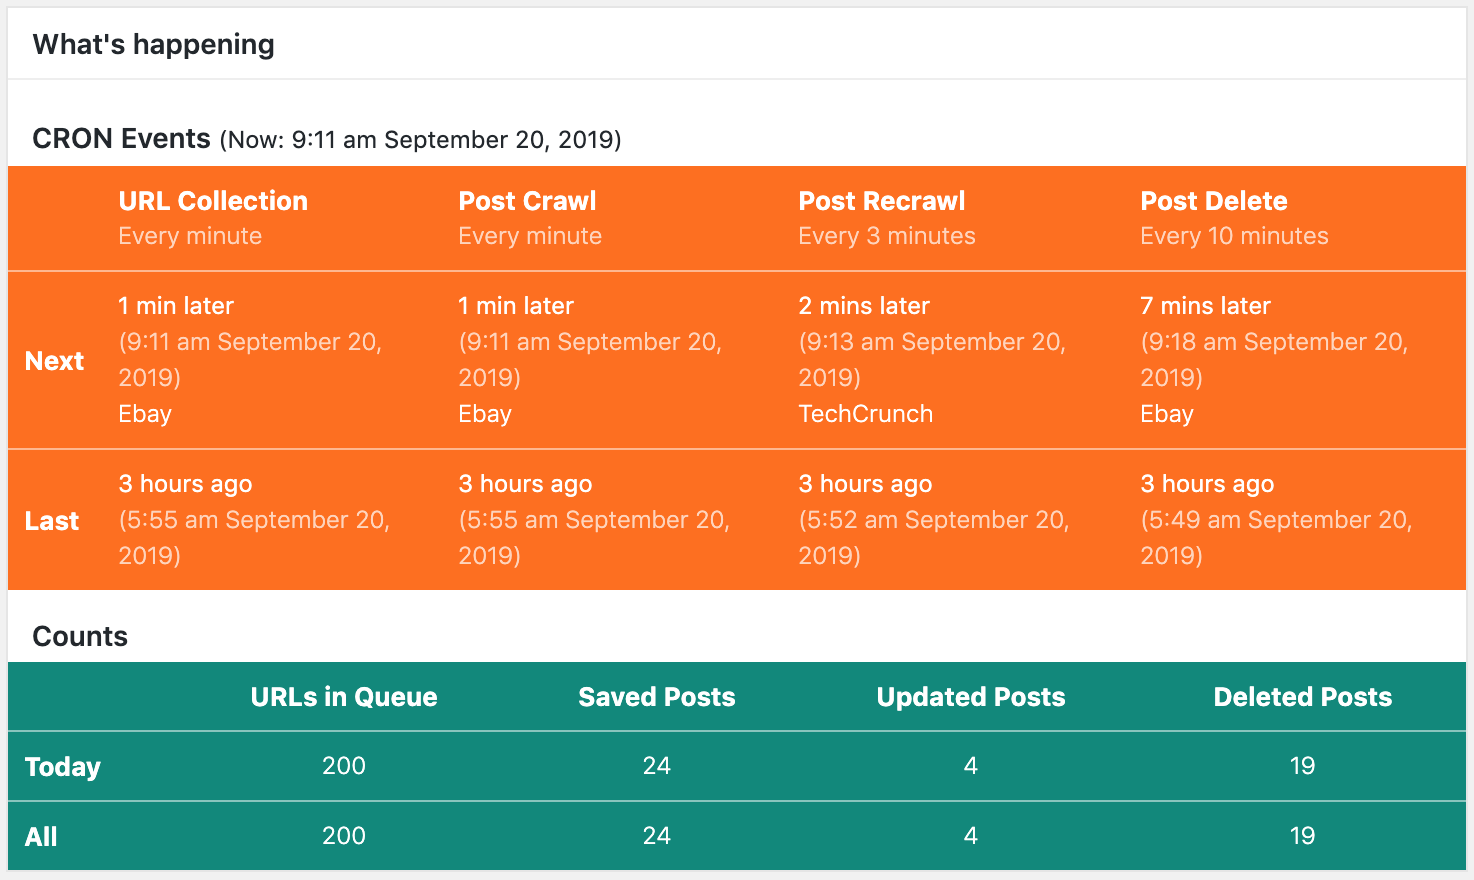
Fig. 8.2 A screenshot of What’s Happening Section
Fig. 8.2 shows a screenshot of What’s Happening Section. The parts of this section is explained as follows.
- CRON Events
This part shows when was the last time an event was run and when will it be run next. The column names are the names of the events. The row at the top displays the next time an event will be run, while the one at the bottom displays the last time an event was run.
Next to the column names, the interval of time each event should run is displayed. These are the intervals defined by you using the settings under Scheduling Tab of General Settings Page. If an interval is not shown next to an event’s name, then it means the event is not registered to WordPress. If that is the case, please save the general settings again so that the events get registered to WordPress.
Nextrow displays the next time an event will be run. Therefore, the time must refer to the future. In other words, you should see values such asx minutes later. If you seex minutes agoor-, then there is probably a problem with WP-Cron. You should fix the problem because WP Content Crawler depends on WP-Cron to automatically run the events. Next to the time values shown inNextrow, the name of the site for which the event will be run is displayed.Tip
If you want the time values to show the seconds, you can customize the time format as explained in Formatting Date and Time at WordPress, because WP Content Crawler uses the time format defined in WordPress settings.
- Counts
- This part displays the total number of URLs in the queue and the total number of posts
crawled, recrawled, and deleted.
Todayrow displays these numbers by considering the ones that happened in the current day, starting from00:00:00until23:59:59.Allrow displays the numbers without any restriction. In other words, it considers every URL and every post that exists. While the numbers in Active Sites Section are found by considering the URLs and posts for each specific site, the numbers in this section takes into account all of the sites. - Posts Being Saved Right Now
- This part displays the posts that are currently being saved, such as being recrawled right now. If there are no posts being saved currently, this section is hidden.
- URLs Being Crawled Right Now
- This part displays the URLs that are currently being crawled, i.e. a post is created. If there are no URLs being crawled currently, this section is hidden.
8.3. Last Crawled Posts Section
This section shows the last posts created in your site by WP Content Crawler.
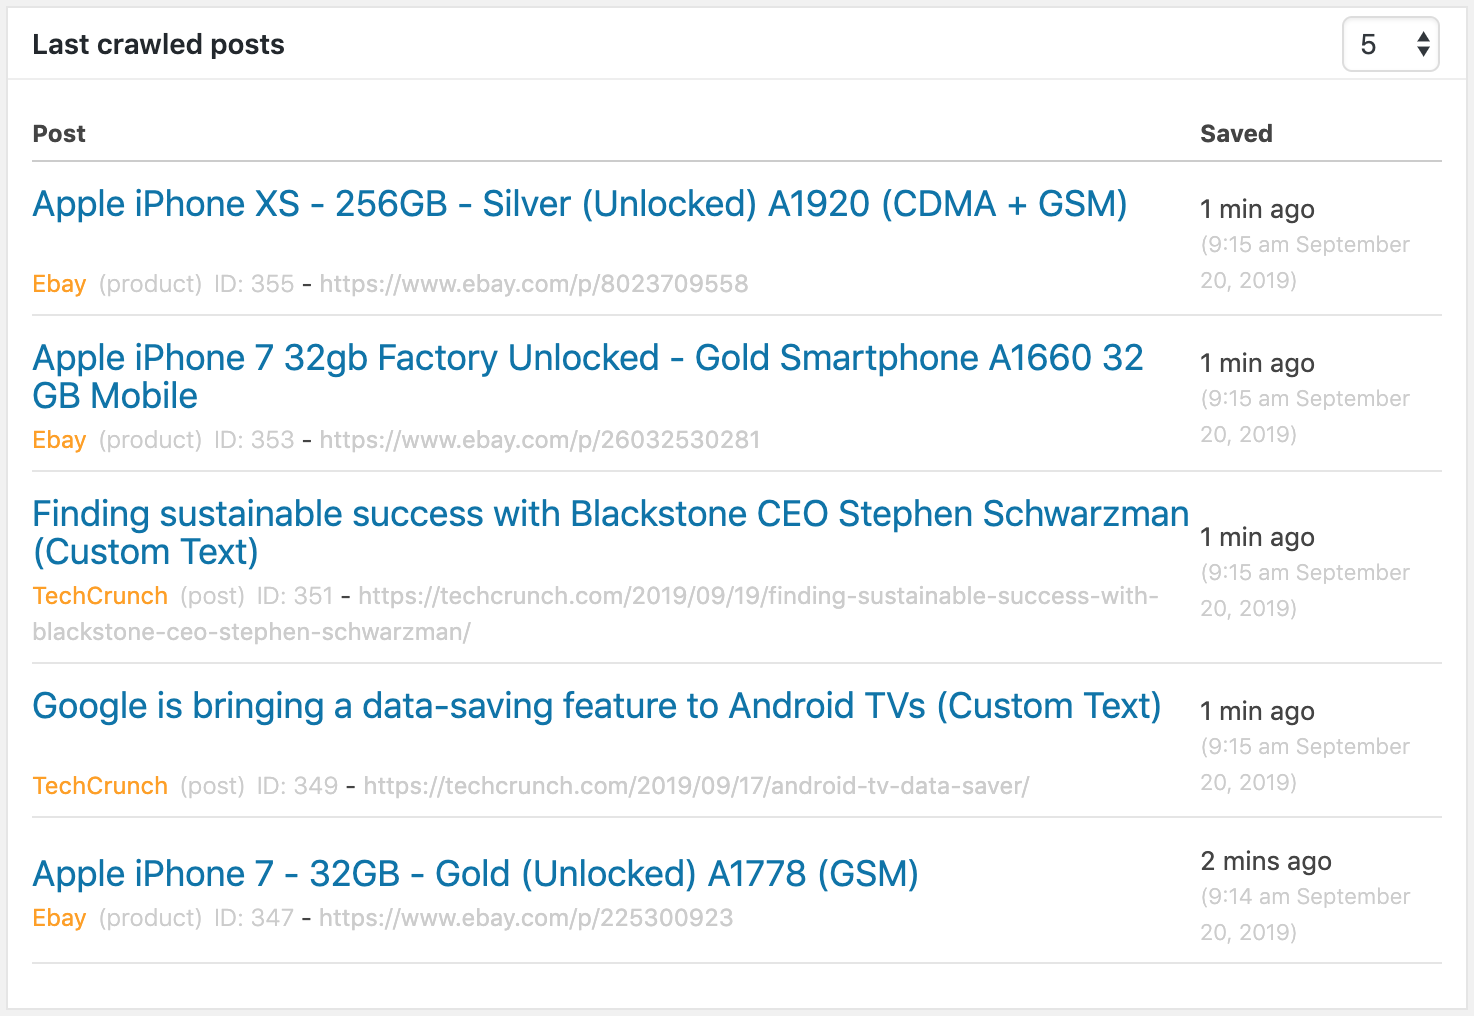
Fig. 8.3 A screenshot of Last Crawled Posts Section
Fig. 8.3 shows a screenshot of this section. The columns are explained as follows.
- Post
- This column contains the name of the post which you can click to see the post in the front end. At the bottom, you can see the name of the site that is used to crawl the post. You can click to the site’s name to go to its Site Settings Page. Next to the site name, the post type is displayed, which is selected by you using Post Type setting. Also, ID of the post and the URL of the post from the target site are displayed as well.
- Saved
- This column displays the post’s publish date. If you define the post’s publish date using the settings under Date Section, then that date will be displayed here.
Tip
Using the select input at the top right corner of this section, you can change how many items should be displayed in this section at maximum.
8.4. Last Recrawled Posts Section
This section shows the last updated posts in your site by WP Content Crawler.
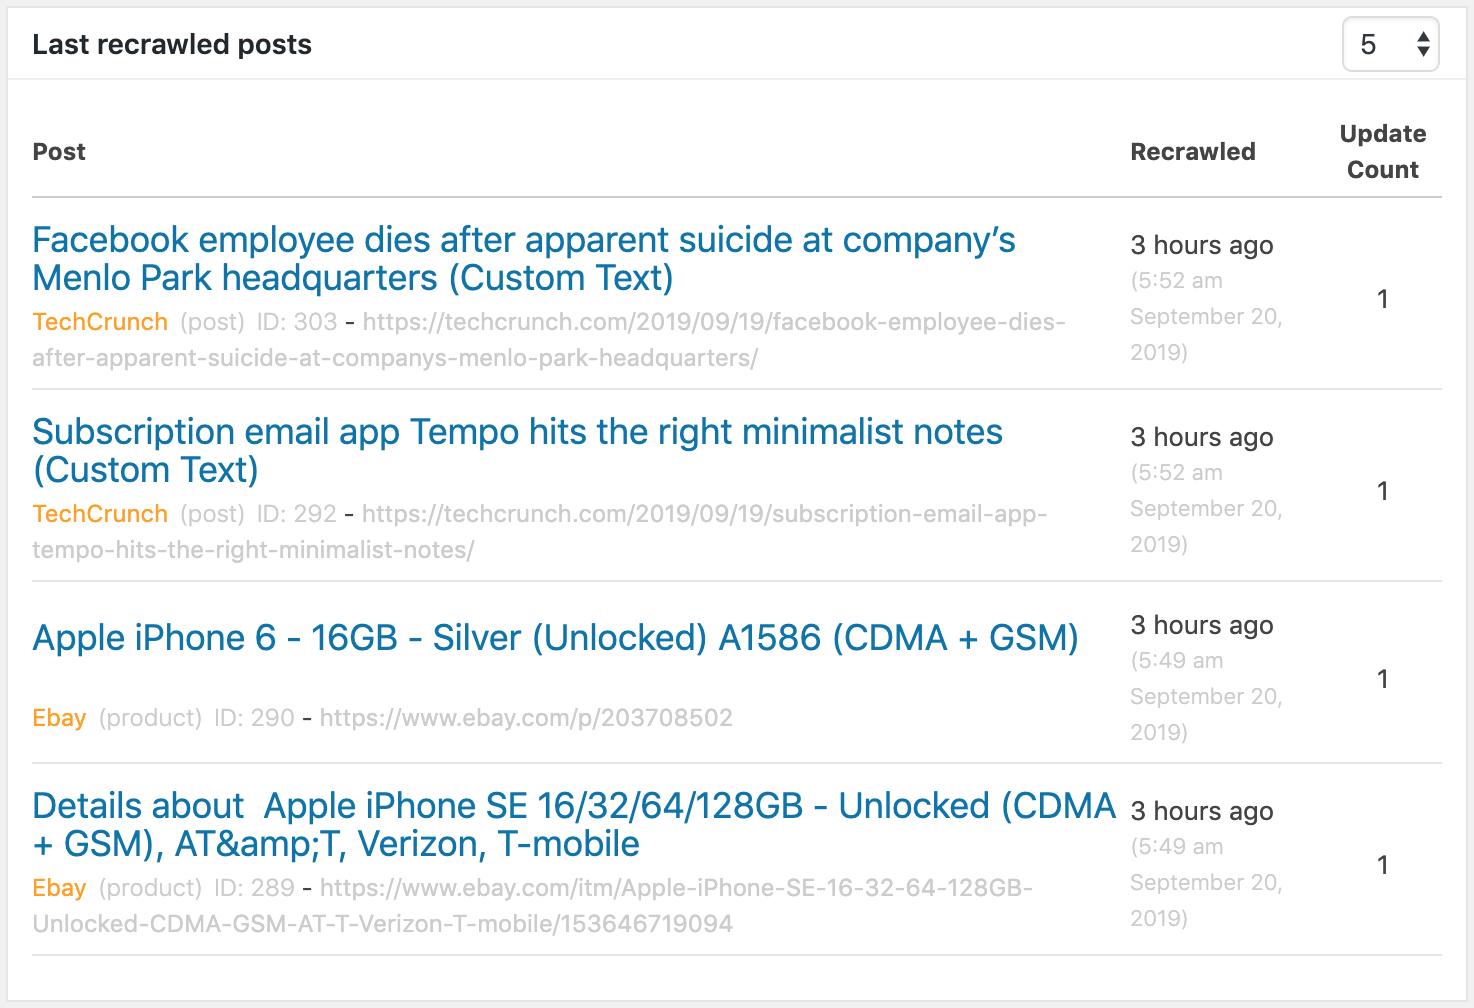
Fig. 8.4 A screenshot of Last Recrawled Posts Section
Fig. 8.4 shows a screenshot of this section. The columns are explained as follows.
- Post
- This column is the same as the post column of Last Crawled Posts Section.
- Recrawled
- The date and time when the post was updated the last time
- Update Count
- How many times the post was updated
Tip
Using the select input at the top right corner of this section, you can change how many items should be displayed in this section at maximum.
8.5. URLs of The Last Deleted Posts Section
This section shows the URLs of the last deleted posts. Because the posts do not exist anymore, only the URLs of them, from the target web site, are displayed.
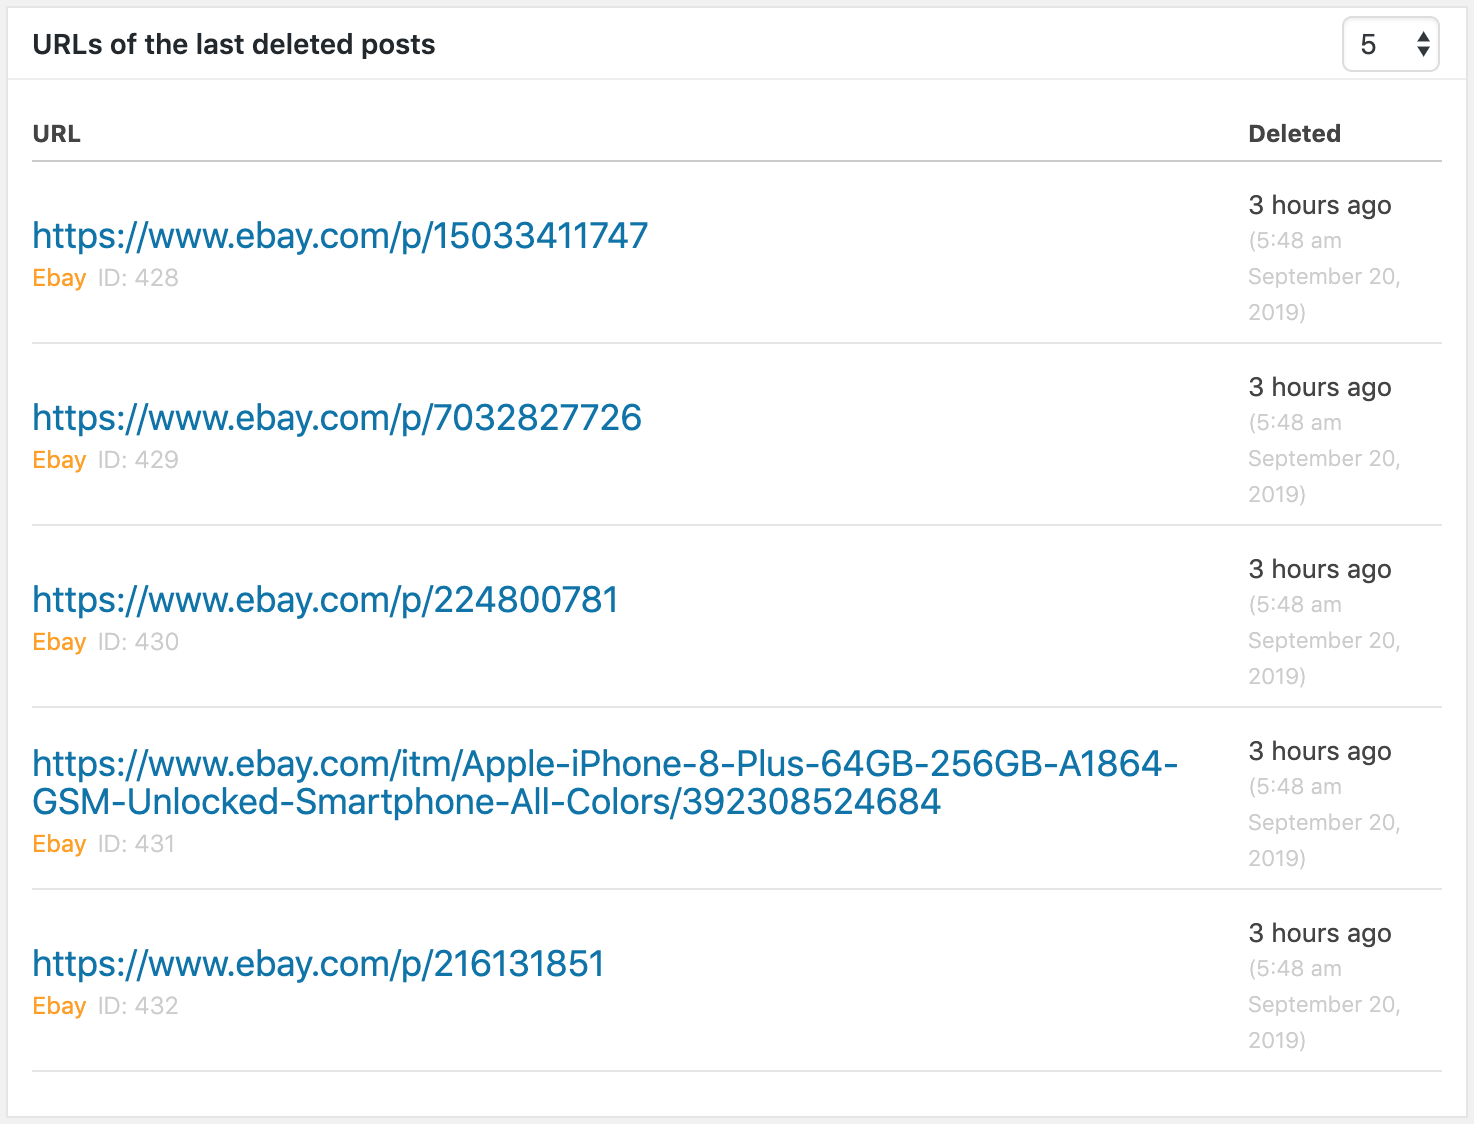
Fig. 8.5 A screenshot of URLs of The Last Deleted Posts Section
Fig. 8.5 shows a screenshot of this section. The columns are explained as follows.
- URL
- URL of the deleted post from the target site. At the bottom, the name of the site whose settings were used to save the post existing at that URL is shown. You can click to the name of the site to go to its Site Settings Page. Next to the site name, the ID of the URL in the database is shown.
- Deleted
- The time when the post was deleted
Tip
Using the select input at the top right corner of this section, you can change how many items should be displayed in this section at maximum.
8.6. Last URLs Added to The Queue Section
This section shows the last URLs that are added to the database. The URLs in the database, waiting to be saved, are called the URLs in the queue.
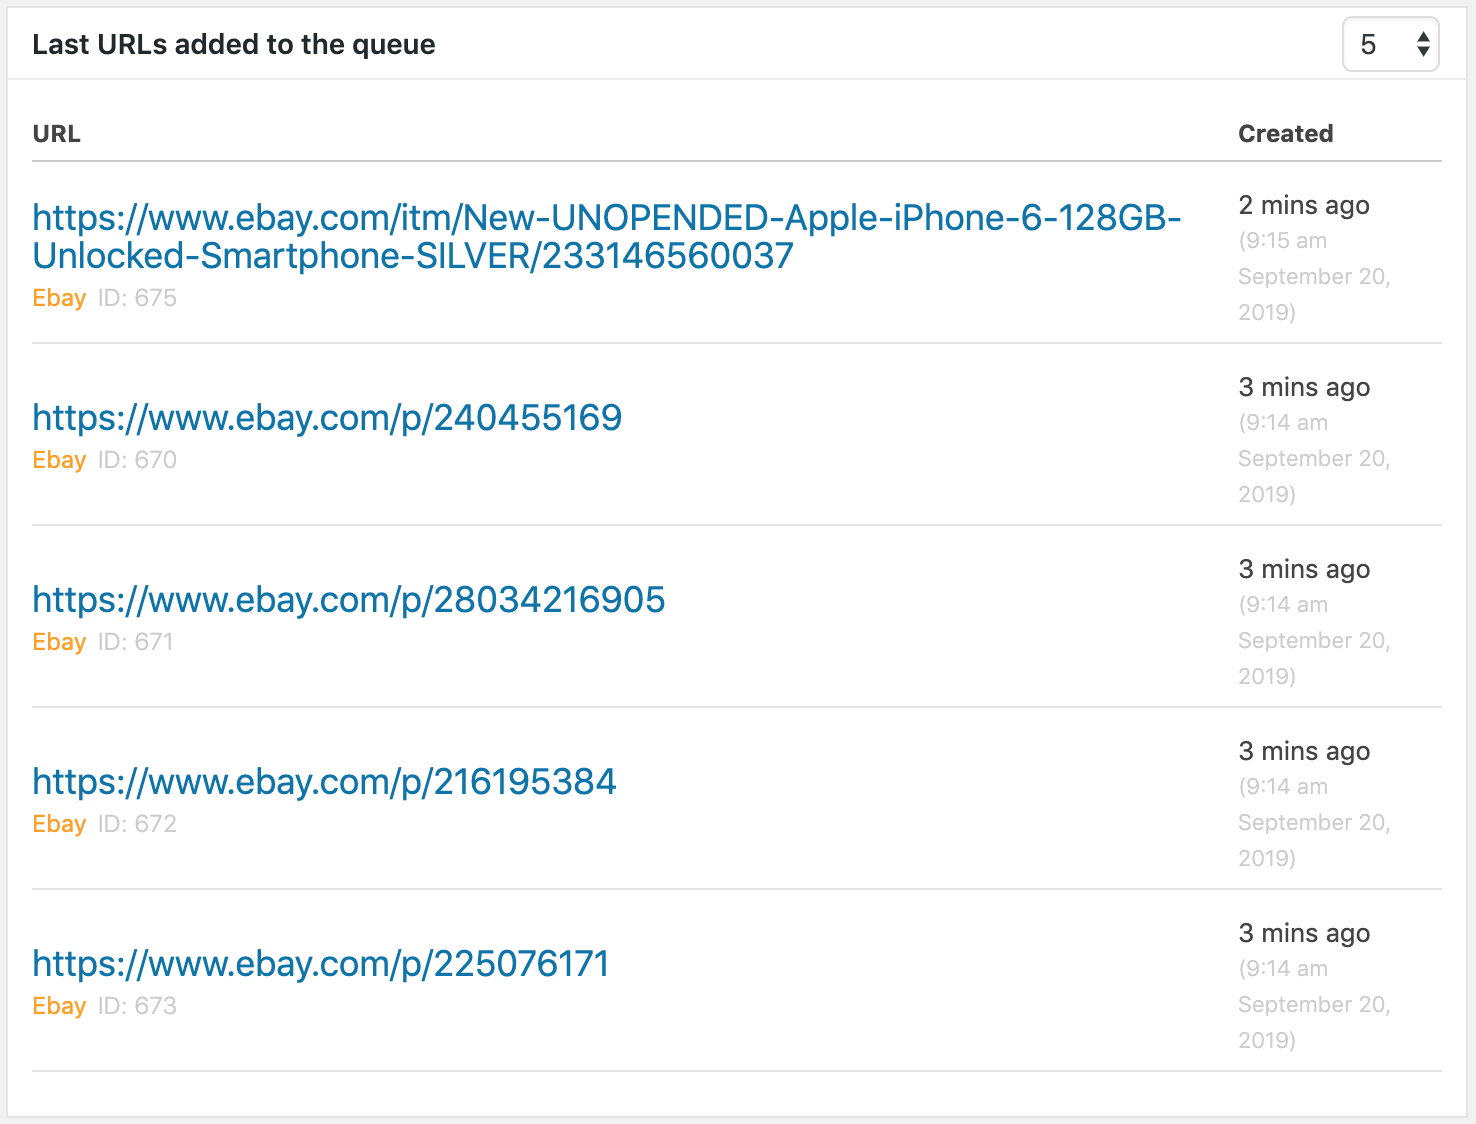
Fig. 8.6 A screenshot of Last URLs Added to The Queue Section
Fig. 8.6 shows a screenshot of this section. The columns are explained as follows.
- URL
- This is the same as the URL column of URLs of The Last Deleted Posts Section.
- Created
- The time when the URL was added to the database