8. Tester Page
This page is used to test the settings configured in Site Settings Page and General Settings Page altogether. The aim of this page is to let you test your settings before enabling automatic crawling. After you are satisfied with the results, it is aimed that you do not see any surprises when the posts are crawled automatically. If there are any errors in your configurations, then this page will show you the errors. If you are not sure, for example, whether the find-replace rules are applied as you expect or not, you can see the final results in this page and get confident with your configurations. In short, everything that will be saved is shown to you in their final forms in this page, including translation and spinning settings.
Important
After you test a post by using this page, it is also recommended to save a sample post by using Tools Page to ensure everything works as you expect, because certain things can be tested only by saving a post.
Using this page is quite straightforward. This page contains only a few inputs. These are explained as follows.
- Site
Select the site whose configurations you want to test.
Important
Only published sites are shown.
- Test Type
Select the type of test you want to perform. This input has two options:
- Category Page
- When you select this, you indicate that you want to test a category page. You should provide a category URL from the target site.
- Post Page
- When you select this, you indicate that you want to test a post page. You should provide a post URL from the target site.
- Test URL
Enter full URL of the page that you want to test. The URL must start with
http.When the test type is selected as Category Page, an additional select input will be displayed. This input contains the category URLs you entered into Category URLs setting. The URLs are displayed as how the plugin sees them. So, if a URL is not correct, you should fix it from Category URLs setting. You can see if that URL can be crawled by selecting as the test URL.
After you fill all of these inputs, click button to perform the test. After this button is clicked, the plugin will crawl the target page and show you the test results in the same page.
An example usage is demonstrated in the following video.
You can see that a few errors are shown in Information Section of the test results. If there are errors, you should fix them in your settings and then perform the test again to make sure the errors are fixed.
8.1. Template Section
This section displays different things for different test types. What this section displays for each type is explained below.
- Category Page
- For this test type, this section displays post URLs found inside the given category page. Additionally, if settings under Featured Images Section are configured. If settings under Next Page Section are configured, this section displays the next page URL and a button next to it, which you can click to test the next category page.
- Post Page
For this test type, this section displays the content of the post, if you configured Post Content Selectors setting and the selectors found content in the target page. Additionally, you can see the source code of the post content by clicking to
Toggle source
code
link, as shown in Fig. 8.1.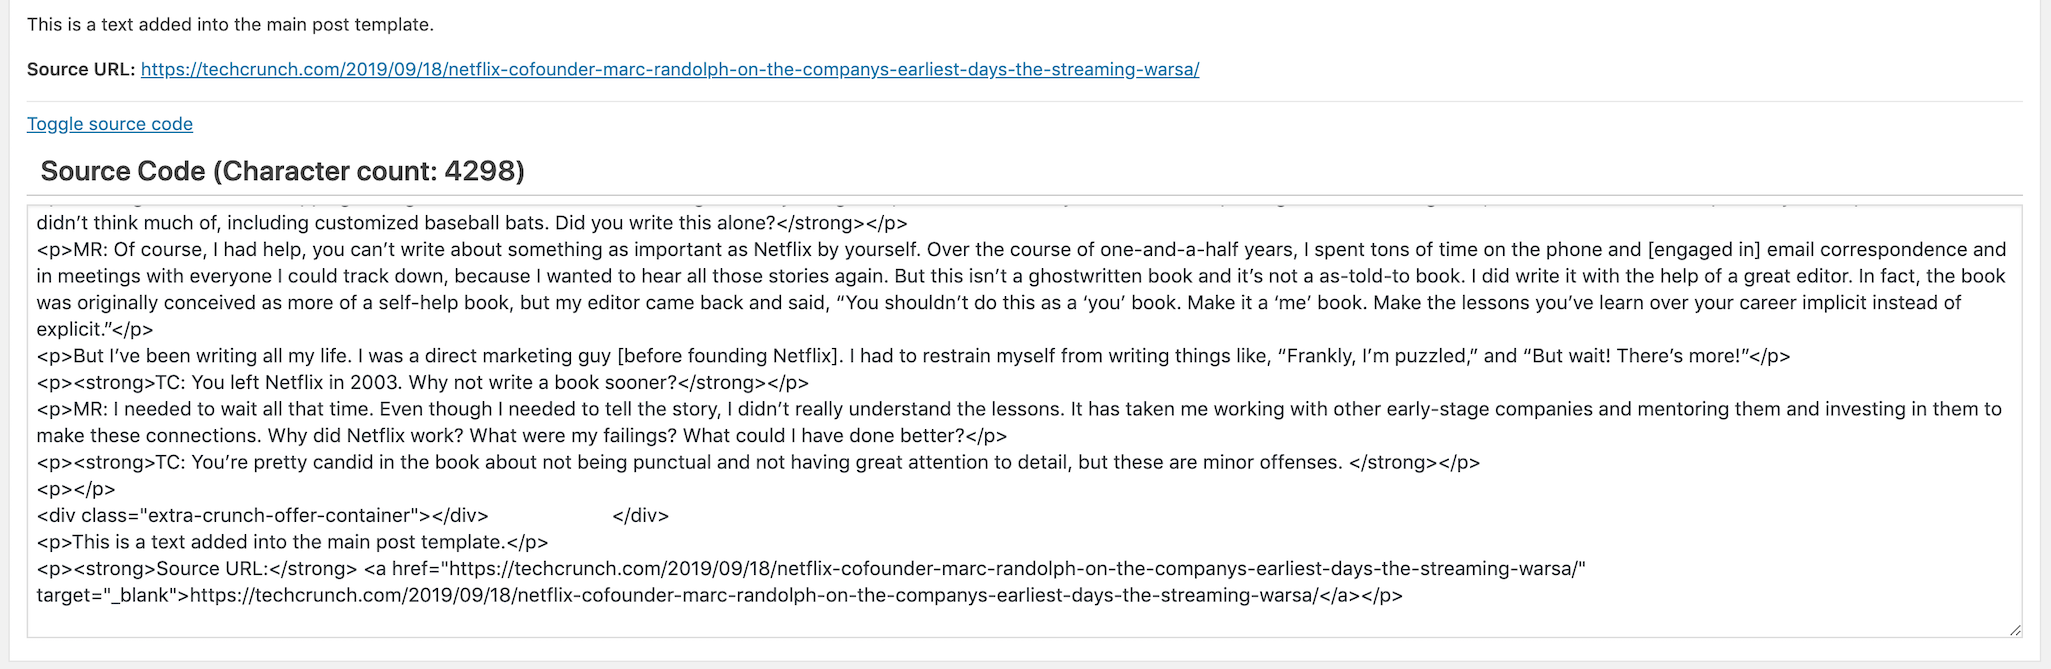
Fig. 8.1 Source code of the post content, displayed by clicking to
Toggle source codelinkTip
To hide the source code, simply click to the same link again.
You can observe the source code of the post content and check if everything looks like as you want. If not, you can go to Site Settings Page and make your changes.
8.2. Details Section
This section displays extra information depending on the test type. For both test types, you can
see how much time it took to complete the test and how much RAM was used in Performance
section, as shown in Fig. 8.2.
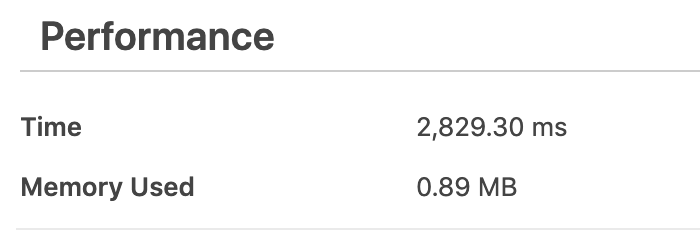
Fig. 8.2 Performance section
Important
In Fig. 8.2, the test took about 2.8 seconds and
consumed 0.89 MB of RAM. You can use this information when defining the settings under
Scheduling Tab of General Settings Page. For example, let’s say it takes 30
seconds to save a post and Post Crawl Interval setting is set to every minute.
In that case, if you set Run count for post crawling event to 3, only 2 of them will
be saved in a minute. The other one will be crawled in the next minute. However, in the next
minute, another 3 posts must be crawled. So, your server load will keep increasing
because the plugin will not be able to complete the task in a minute since it is not possible
to save those 3 posts in a minute. Therefore, you can easily deduce that the maximum
value for Run count for post crawling event is 2 if saving a post takes 30 seconds and
Post Crawl Interval is set to 3.
In short, make sure the following condition holds:
Other details that are specific to the selected test type are explained for each test type, below.
- Category Page
- For this test type, you can see the next page URLs in this section. You can check them out and test if they work, e.g., by clicking to them and ensuring that the page exists in the target web site. You can also use buttons next to the next page URLs to test them.
- Post Page
For this test type, this section displays every post detail other than the post content, which is shown in Template Section. For example, you can see the title, date, tags, details of saved images, custom post meta, custom taxonomies, and so on. An example of what this section displays is shown in Fig. 8.3.
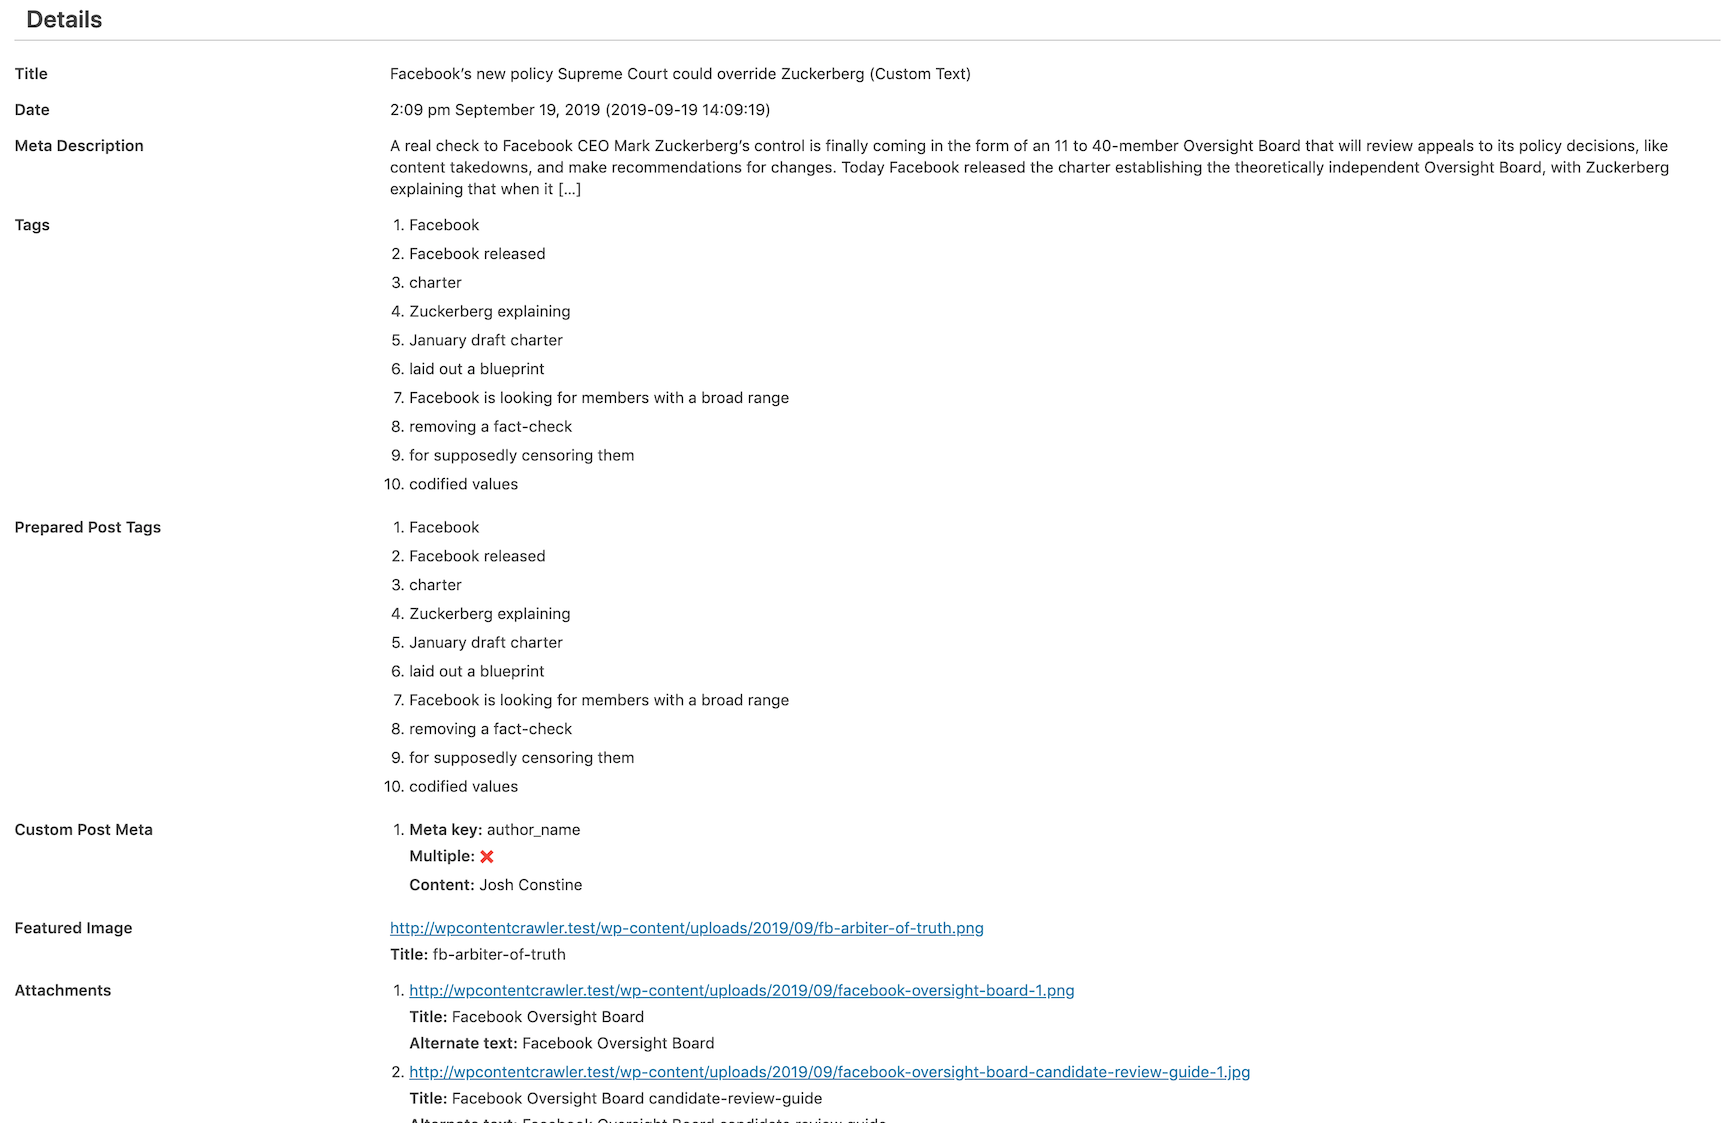
Fig. 8.3 An example of Details Section for Post Page test
8.2.1. Filter Setting Explanations Section
This section displays the explanations of the filter settings (See: Filter Setting) that have at least one filter in them. The explanations are included so that you can easily see which filters are executed, which are not executed, which conditions are met, how much resource a command or a condition block used or what a command did. The explanations have the same user interface as you get when you collapse a filter (Fig. 12.2).
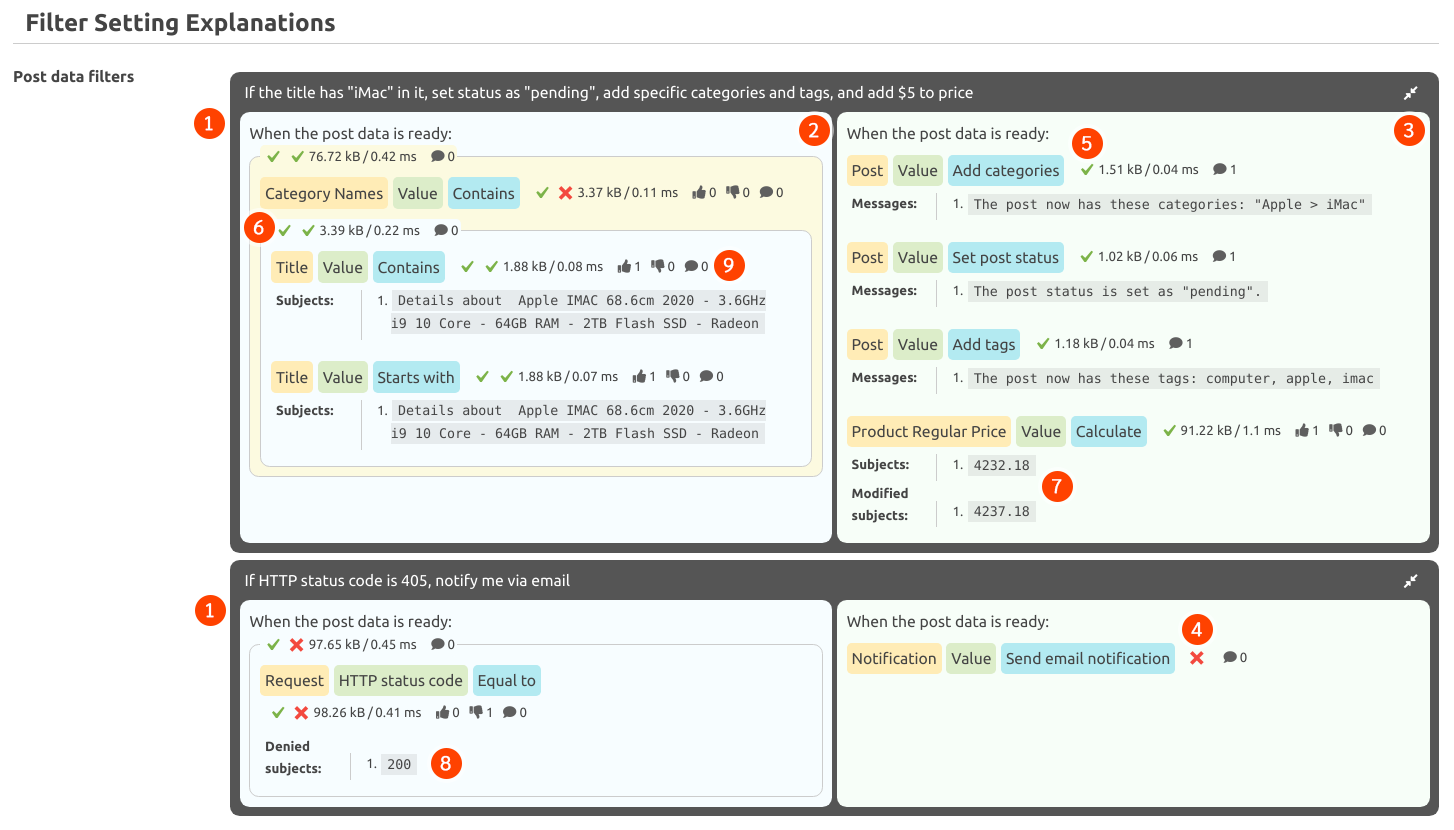
Fig. 8.4 An example of the explanations for Post data filters. This figure contains numbers 1 -
9. Open the image in a new tab to see it bigger.
Each numbered part shown in Fig. 8.4 is explained below:
1: Explanation of a single filter in a Filter Setting 2: Explanation of the filter’s if part (or condition part). The condition blocks having yellow background have oras their Condition operator, while the ones having blue background haveand.3: Explanation of the filter’s then part (or action part) 4: This red cross icon indicates that the command is not executed. For this filter, the action command was not executed, because the filter’s condition was not met. 5: This green check icon indicates that the command is executed. 6: The green check icon on the left indicates that the Condition block is executed, while the one on the right indicates that the Condition block’s condition is met, i.e. the condition defined in the condition block is satisfied. Next to the check icons, 3.39 kB(3.39 kilobytes) indicates how much memory is used to execute the condition block, while0.22 ms(0.22 milliseconds) indicates how much time it took to execute the condition block.7: Subjectspart shows the subjects given to the command, i.e. the values that the command worked with.Modified subjectspart shows how the command changed the value. For example, this command received4232.18and changed it into4237.18, because the command was configured to add5to the given number.8: Denied subjectspart shows the subjects that did not meet the condition specified by the Command. For example, this condition command checked if the HTTP status code was equal to405. Since the actual status code was200, the condition was not met.9: The thumbs-up icon shows how many subjects meet the condition or processed by the action command. The thumbs-down icon shows how many subjects are denied to be processed. The message icon shows how many messages there are for the command. You can see other commands’ icons in the figure for more examples. The messages explain what the command did or resulted in. The messages vary from command to command. You can consider them as useful information to clarify what happened during the execution of the command.
8.3. Information Section
Being available in all test types, this section displays information messages, such as errors. An example of this section can be seen in Fig. 8.5.
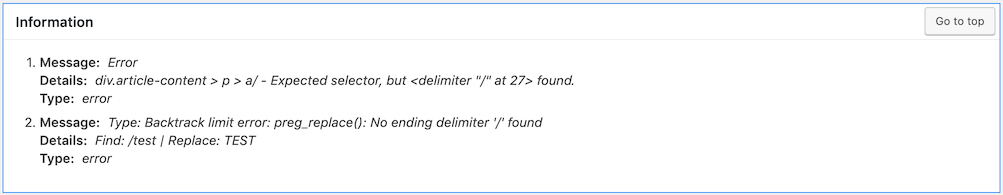
Fig. 8.5 An example of Information Section, showing a few errors related to defined CSS selectors
As it can be seen in Fig. 8.5, there are problems in defined CSS selectors. When you see such errors, you can fix them in your settings and then test the same page again to check if the errors are gone. If the errors are still there, you can repeat this process until the errors are gone.
8.4. Recent Tests Section
This section displays the recent tests you performed so that you can easily repeat them.
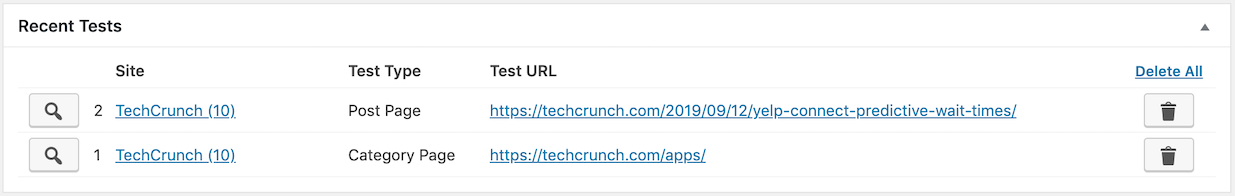
Fig. 8.6 An example of Recent Tests Section
An example of this section is shown in Fig. 8.6. As you can
see, there are two previously-performed tests shown. You can click to button of a test
to repeat it. You can also use Delete all link to delete all of the tests shown in this section.
Tip
The tests in this section are ordered according to the date of test in descending. In other words, the most recent test is always shown at the top of the list while the oldest test is shown at the bottom.